
$500 a month is the target half the internet types into a dividend calculator. So we typed it into the Dividend Income Builder, on its default $150,000 of capital, any payers, payouts spread across the year. The answer it gave is more interesting than a yes, and it is the best tour of what this tool is for:
1. The honest verdict comes first
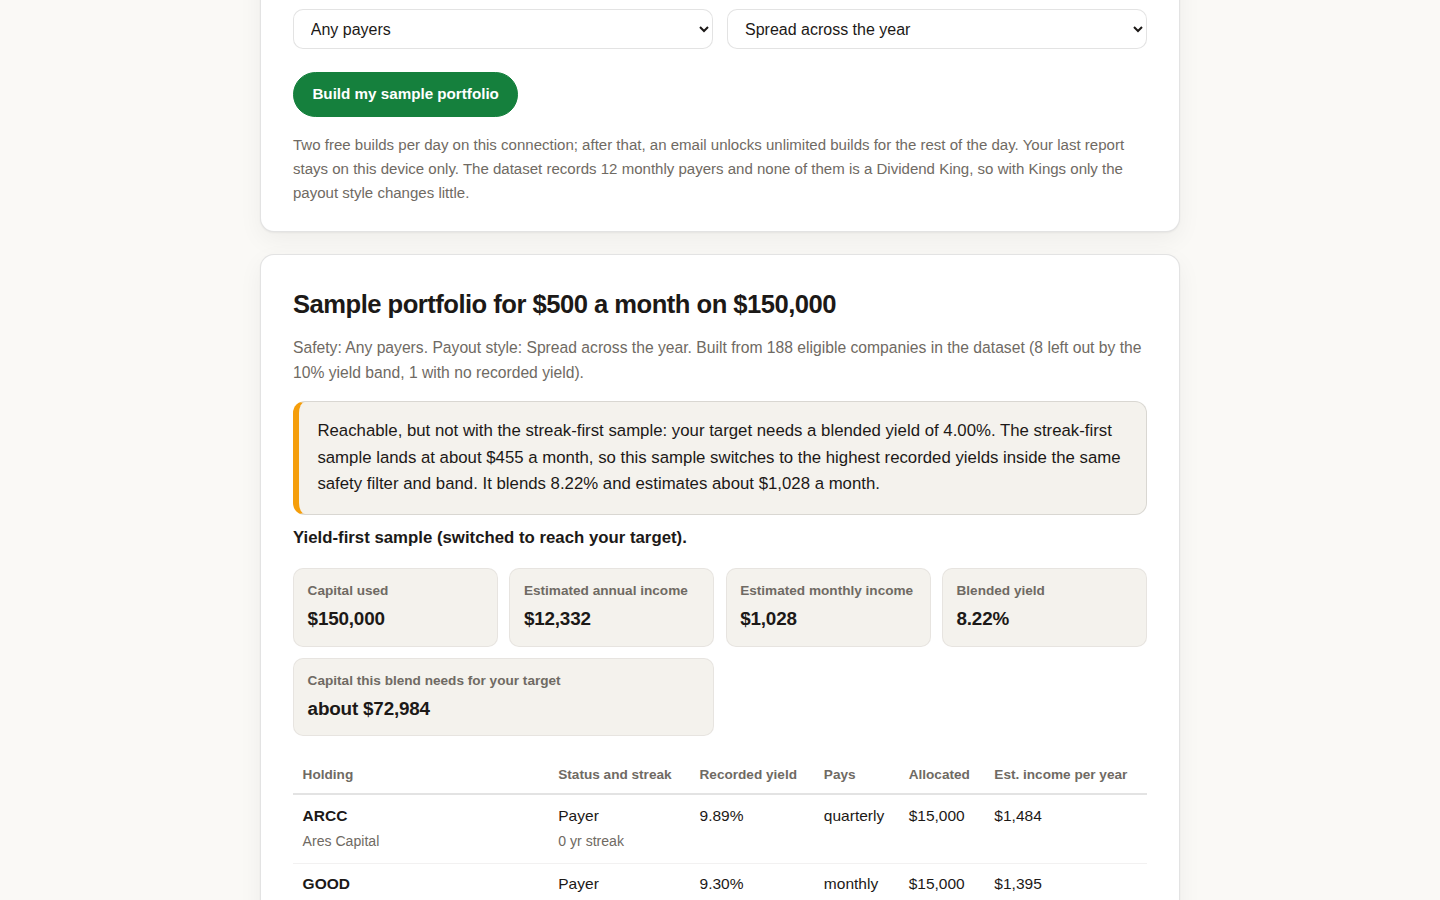
Of the 197 companies in the dataset, 188 were eligible for the build: 8 left out by the 10 percent yield band, 1 with no recorded yield. Then the plain sentence: reachable, but not with the streak-first sample. The sample that puts dividend streaks first lands at about $455 a month, short of the target. Most calculators would quietly hand you the higher number. This one shows you both.
2. What reaching the target actually takes
To reach $500, the builder switches to the highest recorded yields inside the same safety filter and band. The blend comes out at 8.22 percent, an estimated $1,028 a month on the full $150,000, and the report adds the most useful line of all: this blend needs about $72,984 to pay your $500 target. Read that line backwards and it is a savings goal with a date on it.
3. The yield-first shelf is not the sleep-well shelf
The holdings tell the story: Ares Capital at a recorded 9.89 percent, Gladstone Commercial at 9.30, Gladstone Capital at 9.29, Hercules Capital at 9.05, mostly BDCs and mortgage-linked payers, $15,000 each. The builder warned you before you saw them: the dataset's highest yields carry cut histories in the same data. One name bridges both worlds, Universal Corporation, a Dividend King with a 56 year streak at a recorded 7.38 percent. Our payout ratio guide is the check to run on any single holding the blend tempts you with.
4. Safety settings are a real dial, not a label
Run the same target with Aristocrats and Kings only and the eligible pool shrinks to the streak aristocracy; the blend, the income and the capital needed all move. Kings only changes the payout style less than you would expect, for a reason the tool states on its face: it records 12 monthly payers and none of them is a King. The Kings versus Aristocrats comparison explains the two clubs before you choose between them.
5. Monthly payers change the rhythm, not the math
Emphasize monthly payers and the income arrives twelve times a year, which suits rent-and-bills budgeting. Our monthly dividend stocks list covers the candidates; the builder shows what a monthly-tilted sample actually blends to, fees of optimism removed.
6. Print the report and argue with it
The report prints. Take it to the conversation with your advisor, or your own spreadsheet, and argue line by line: this yield is a trap, that streak is worth the lower blend, this capital figure is two years away, not five. A sample portfolio built from recorded yields, with its left-out companies counted and its shortfall admitted, is a starting point that respects you. Cross-check the names against a broad fund with the ETF Overlap X-Ray at ETFCompare, or check what insiders are doing with the same names in the Insider Sentiment Gauge at StocksPro24. Then run your own number: open the Dividend Income Builder.